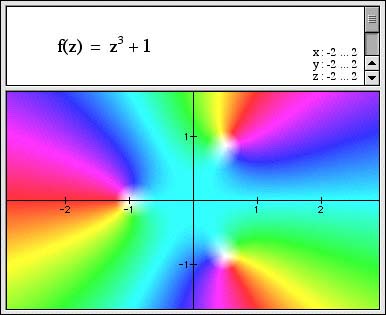
A complex function of a complex variable can be drawn as a 2D color map. In the image above, the hue represents the phase of the complex function and the saturation indicates its magnitude. The zeros of the function are white.