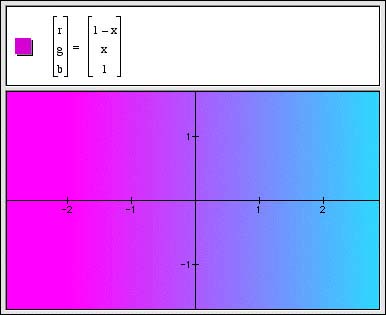
You can specify the color at each point by giving functions of x and y for each of the red, green, and blue components. Density plots are a special kind of color map.